
Compare location rankings
How do I compare local rankings across all locations?
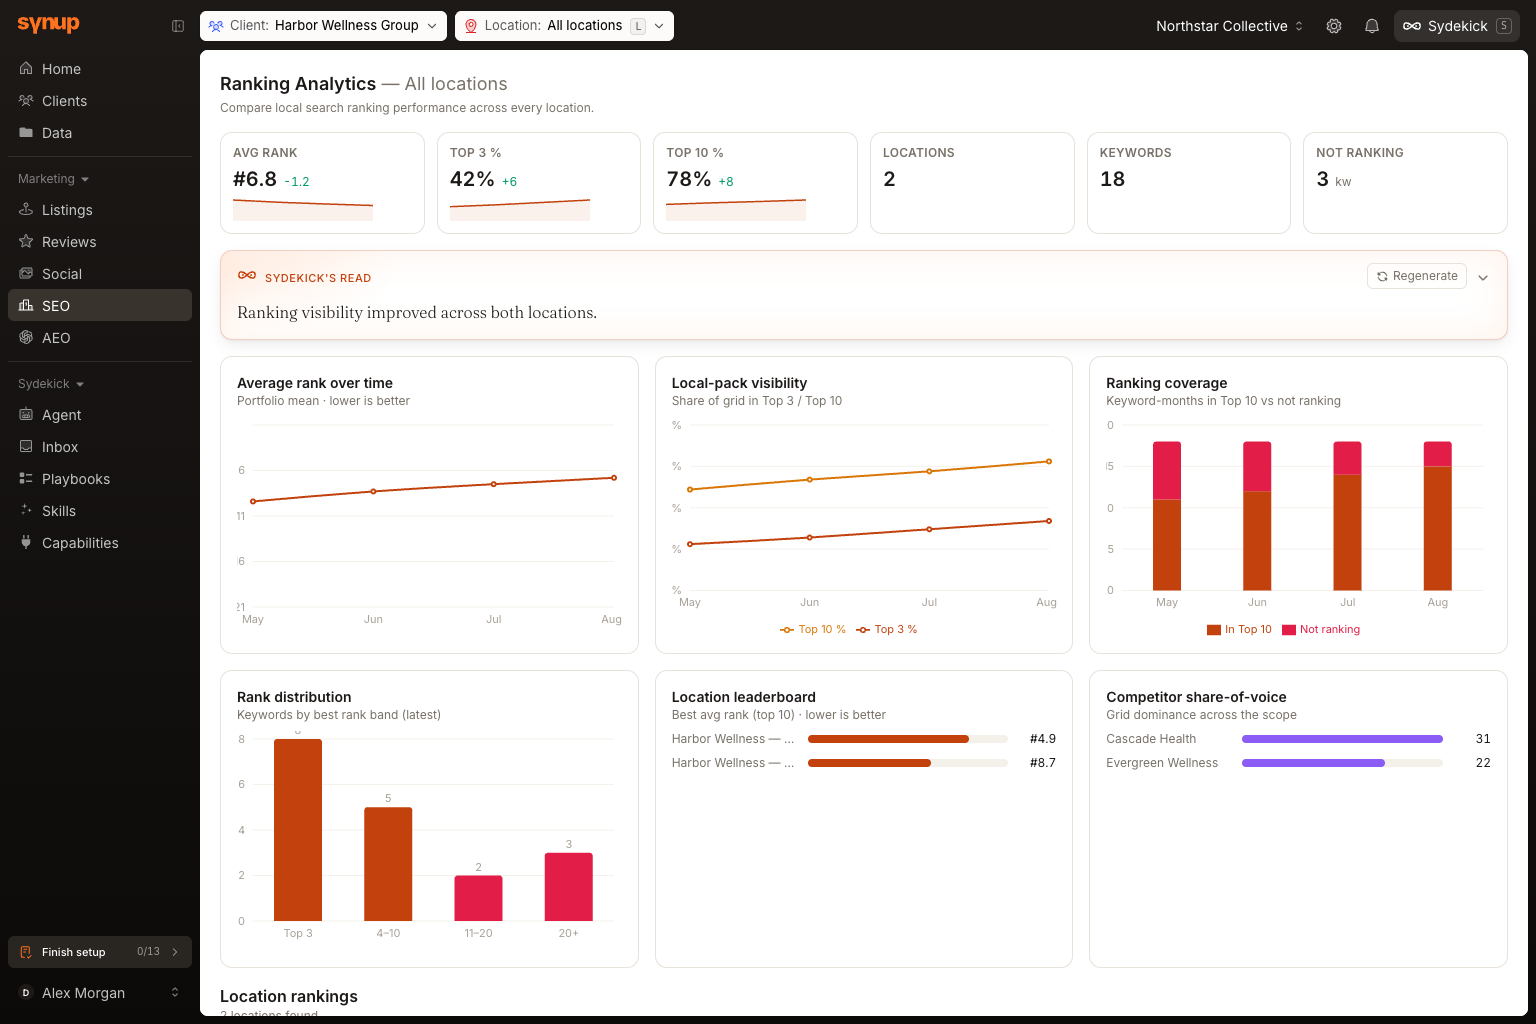
Set the location picker to All locations and SEO → Ranking Analytics stops being one location's grid and becomes a portfolio view: headline KPIs across the whole scope, a location leaderboard, and a Sydekick summary of what to prioritize. There are no tabs at this level — the roll-up is a single view.
Key facts
| Where it lives | SEO → Ranking Analytics, with the location picker on All locations |
| What you need first | A selected client and at least one location with a tracked keyword and generated ranking report. Two or more reporting locations are needed for a meaningful comparison |
| What it changes | Nothing. The roll-up summarizes existing ranking reports |
Why this matters
The roll-up separates portfolio-wide patterns from one-location results. It lets you compare reporting locations, then open a detailed grid without losing the client scope you were comparing.
Steps
Choose a client, then leave the location picker on All locations.
Open SEO → Ranking Analytics and start with the Priorities in the Sydekick summary.
Compare Avg Rank, Top 3 % and Top 10 % across the portfolio charts.
Search Location rankings for a location you want to investigate.
Select its row to open that location's detailed rank grid.
What you'll see when it's done
- A single portfolio view with no location-level tabs.
- KPIs and charts calculated from locations that have generated reports.
- A searchable location table that opens the selected location's rank grid.
What the roll-up shows
Sydekick summary sits at the top, with Priorities and Wins and a set of starter prompts you can send straight into the Sydekick panel.
Beneath it, six KPIs cover the scope: Avg Rank, Top 3 %, Top 10 %, Locations, Keywords and Not Ranking. The first three can show a change indicator when there are at least two months of data and the value moved.
Then a set of portfolio charts — Average rank over time, Local-pack visibility, Ranking coverage, Rank distribution, a Location leaderboard ranked by best average rank, and Competitor share-of-voice across the whole scope.
Finally Location rankings, a searchable table with a row per location: Location Name, Avg Rank, Top 3 %, Top 10 % and Best Keyword. Click a row to drop into that location's own grid.
Only locations with generated reports appear
This is the thing to know before you go looking for a location that isn't there.
The roll-up is built from ranking reports, not from your location list. A location with no tracked keyword and no generated report contributes nothing — it does not appear in Location rankings, it isn't counted in Locations, and it doesn't move the KPIs. A portfolio of fifty locations where three have reports produces a three-location roll-up.
So Locations 1 does not mean you have one location. It means one location has ranking data, and the KPIs above it describe that single location rather than your portfolio.
Watch out for
- Compare like with like. Locations measured at different grid spacings cover different amounts of ground, so their Top 3 % figures are not strictly comparable. The leaderboard will still rank them.
- Scope changes what you are averaging. Selecting a client narrows the roll-up to that client's locations. With no client selected the page asks you to choose one first.
Questions people ask
A location I know has rankings isn't in the table. Why?
Check that it has a keyword with a generated report, and that the client scope you're in actually contains it. The roll-up only includes locations with report data inside the selected scope.