
Read Ranking Analytics
How do I read Ranking Analytics and decide what to fix first?
SEO → Ranking Analytics answers one question: when someone near your business searches for what you sell, do they find you — and where do they stop finding you? Synup measures your position at the points in your configured 3×3, 5×5 or 7×7 grid, then summarises the result in five cards and four tabs. A business can rank strongly near its address and disappear farther away; the page shows you where that change happens.
Where you are on the page
Pick a client and a location in the top bar. The page title carries the location name, so you always know whose rankings you are looking at — here, a downtown Houston hotel tracking hotel downtown houston.
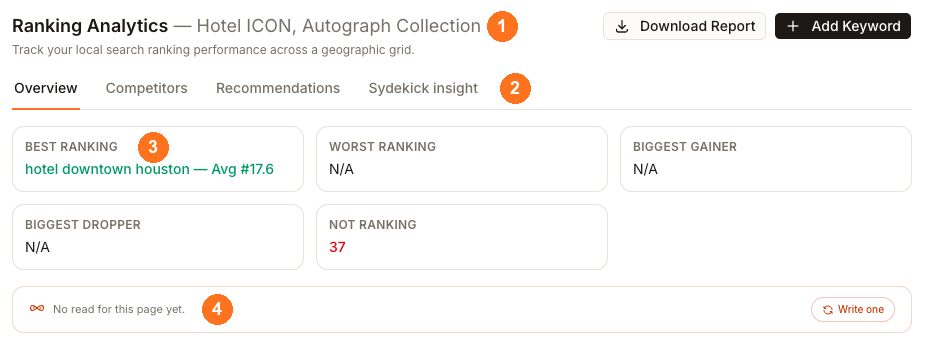
① the location this page describes ② the four tabs ③ the five stat cards, which describe the location rather than the open tab ④ Sydekick's read of the page, which you can ask for at any time.
Leave the location picker on All locations and the same route becomes a portfolio roll-up instead — one view, no tabs.
The four tabs, and which one you actually need
Overview
- When to open it
- You want to see where you rank, geographically
- What it holds
- The rank grid, the keyword list, the rank legend and the per-keyword trend
- Needs
- One generated report
Competitors
- When to open it
- You want to know who is beating you
- What it holds
- A dominance leaderboard built from your own grid, plus per-competitor detail
- Needs
- One generated report
Recommendations
- When to open it
- You want an impact-labeled list of fixes
- What it holds
- Profile actions, each with reasoning, expected impact and a Synup to-do list
- Needs
- One generated report
Sydekick insight
- When to open it
- You want the analysis behind the numbers
- What it holds
- Competitor gaps, geographic weakness, anomalies, and suggested keywords
- Needs
- One generated report
All four fill from the same thing: one keyword, generated once. You do not need to buy more data to unlock the other three tabs.
What the five cards are telling you
Best Ranking is the keyword you do best on — above, an average of #17.6 across the whole grid. Not Ranking counts the grid points Synup measured successfully where it did not find you in the top 20. In this captured 7×7 example, the hotel ranks first at four points near the property but is outside the top 20 at 37 of 49 points. That combination shows strong visibility in a small pocket and weak reach across most of the measured area.
The other three go quiet for reasons that are not faults:
- Worst Ranking stays N/A until you track a second keyword. With one keyword there is a best and nothing to compare it against, so Synup leaves the card empty rather than printing the same keyword twice.
- Biggest Gainer and Biggest Dropper need two months of history. They stay N/A after your first report and fill in once a second month exists.
Two different reasons a grid point isn't in your numbers
This card is where most of the confusion lives, so it is worth reading slowly. The card below is a different location — a small bed and breakfast in Fairbanks, Alaska — because the Houston hotel measured all 49 of its points and so has no second number to show you.
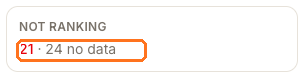
The red number is not ranking — points Synup checked successfully and did not find you in the top 20. The grey number is no data — points Synup did not measure successfully. They are different problems: the first is a ranking result, the second is missing coverage.
Neither number is folded into your averages incorrectly. Synup leaves unmeasured points out of Top 3 %, Top 10 % and Avg Rank entirely, because counting a failed lookup as "rank 21" would report a coverage you don't have.
A third case does not appear in either number by default: grid points that land on water. Synup measures and stores them, then normally hides them and leaves them out of every statistic. Show water points can include them for that location. In this captured Fairbanks example the setting is off, so 21 + 24 accounts for 45 counted points and the other four of the 49 are water.
When the whole grid comes back 20+
That same Fairbanks location is the other end of the range: Avg Rank #21 with Top 3 0% and Top 10 0%. It is not a broken report. 20+ is stored as 21, so a grid where you never reached the top 20 averages exactly #21.
That is a diagnosis, not a dead end, and it is the point at which the other three tabs earn their keep. Competitors shows you who holds the positions you want. Recommendations turns the gap into impact-labeled profile fixes. Sydekick insight explains the pattern and suggests keywords you aren't tracking yet.
Watch out for
- Ranking data does not appear on its own. Until you add a keyword and generate a report, the Overview has no rank grid and the other tabs have no current grid evidence to analyze. Generating costs credits.
- Generating a report is charged per grid point. Read Add rank-tracking keywords before you generate one, particularly the part about grid spacing.
Questions people ask
Why is Biggest Gainer empty when I just generated a report?
It needs two months to compare. Your first report establishes the baseline; the gainer and dropper cards fill in after the next month completes.