
Track rank changes
How do I see how my rankings changed since last month?
Use SEO → Ranking Analytics → Overview after the location has at least two completed monthly reports. The Per-Keyword Rank Trend shows each keyword's average grid rank by month, while the month control lets you reopen the grid for an earlier report and ask What Changed? about one month versus the previous month.
The first report is only a baseline. With one month, Synup can tell you where the business ranks, but it cannot honestly say whether that position improved or declined.
Compare the latest month with the one before it
- Open SEO → Ranking Analytics and select one location.
- Stay on Overview and scroll to Per-Keyword Rank Trend.
- Select the keyword or keywords you want to compare. The chart can show up to 10 at once.
- Read the two latest points for each keyword. A lower rank number is better, so a move from
#12to#7is an improvement; a move from#4to#9is a decline. - Return to Grid Rank Report and use the month control below the map to select either month. The map and its Top 3, Top 10, and Avg Rank figures switch to that stored report.
- After selecting a month, click What Changed? for a summary comparing that month with the one immediately before it.
The trend proves what moved. What Changed? helps organize the change into improvements, declines, likely drivers, and a recommended focus. Treat suggested drivers as investigation clues, not proof of cause; the ranking data establishes the movement, but it does not establish why Google changed the result.
Use the movement cards as a starting point
Biggest Gainer and Biggest Dropper identify the tracked keywords with the strongest improvement and decline across the available stored history. They are a quick way to decide which trend line to inspect first.
If the location has more than two months, do not treat these cards as a strict "last month only" comparison. Use the two latest points on Per-Keyword Rank Trend, or What Changed? on the latest month, for the month-over-month answer.
What one completed month looks like
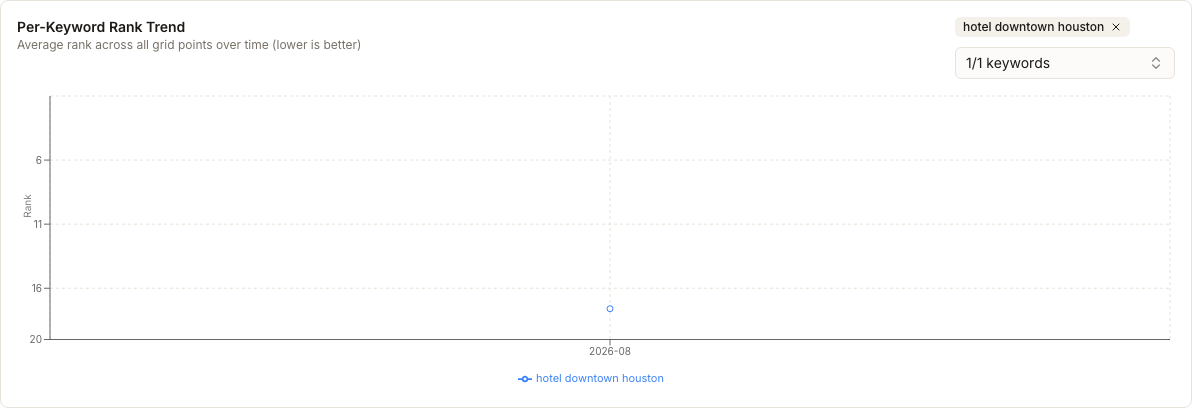
This genuine report has one August result. The current-ranking cards can describe the grid, but Biggest Gainer and Biggest Dropper remain N/A because no earlier month exists.
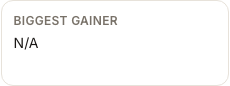
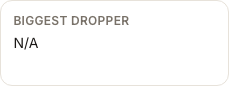
The trend chart still renders the baseline as one point. One point has a position but no direction, so a line is not drawn yet.
With exactly one report month, the month control is hidden because there is nowhere else to move. This is the expected first-month state, not a loading problem.
How a second month becomes available
Synup stores rank-grid reports by calendar month and refreshes active tracked keywords on the recurring schedule. When the first report in a new month completes, it becomes the next point in the trend and unlocks the month comparison.
Running the same keyword again during the same calendar month replaces that month's snapshot; it does not create another history point. A new keyword-month is a new metered grid scan, charged per grid point. Review how keyword reports use credits before adding more keywords or changing the grid.
For a useful comparison, keep the keyword and grid configuration consistent. Changing the spacing changes the coordinates being measured, so a movement may reflect a different search area as well as a ranking change.
Watch out for
- Lower is better. Average rank
6is stronger than average rank14; the trend chart reverses the vertical axis so better positions appear higher. - Missing data can change the average. Compare the grey
N/Agrid points between months before treating a large average-rank swing as a clean ranking movement. - The selected month changes the map, not the current summary cards. Use the map overlay and keyword badges to read the chosen historical month; the five cards summarize current and available-history signals.
- A cause summary is not causal proof. Confirm suggested explanations against profile changes, reviews, competitors, and the exact grid points that moved.
Questions people ask
Why don't I see the month control?
The location has fewer than two completed report months. After the first report, the trend contains one baseline point and the movement cards remain N/A.
Does regenerating this month's report create a new comparison point?
No. Reports are keyed by calendar month, so another run updates the same month's snapshot. History advances when a report completes for a different month.
Why does the chart go upward when the number gets smaller?
Rank #1 is the strongest result. The chart puts lower rank numbers higher so visual improvement moves upward.