
Read Profile Analytics
How do I read Profile Analytics for one location or all locations?
Profile Analytics shows what each publisher reported about your listing — views, calls, direction requests and the rest. The number that matters most on this screen is the one that isn't there: a blank means nobody reported anything, not that nobody visited. Open it from a location's Listings → Profile Analytics.
Start by looking at the date range, not the numbers
The range opens on the last thirty days of data Synup actually holds, which is usually a few weeks behind today. The date picker says why — Publishers finalize analytics with a delay — data is available through … — and it won't let you pick a later day, because there is nothing there yet. Nothing you press will pull it forward; the aggregation runs on its own schedule.

The strip along the top tells you who is reporting before you read a single number. Bing says Not connected and Auto via Synup — Bing needs nothing from you, and its analytics start once the location is live on Bing Places. Apple isn't on this screen at all, because Apple Business Connect has no analytics API yet.
Under the range, No comparison can become Previous period, Previous month, Previous quarter or Previous 6 months, and Day / Week / Month changes the grouping. Day on a long range is mostly noise; week usually reads better.
In a single-location view, open Export and choose PDF for a formatted report or CSV for a data file. In All locations, use CSV; the PDF choice is not yet available there.
What the cards mean
Profile Views sits at the top: how many people saw the listing. Everything below is what they did next — All Actions, Website Visits, Phone Calls, Direction Requests, Button Clicks, Followers and Post Engagement.
A card only appears when a selected publisher has data for it, so the set changes as you change the publisher filter. A card that appears but reads No activity recorded in this range means the publisher is reporting and the answer is genuinely zero.
If Google is in the filter you also get Where you're discovered (Google), which splits views across Maps, Search, Desktop and Mobile, and Top search keywords (Google). Google reports keywords monthly rather than daily, so when the months on show fall outside your range the screen says so rather than quietly mixing periods.
Comparing locations
Set the Location picker to All locations and the same tab becomes a portfolio view: a coverage line such as 3 of 136 locations reporting data, Contribution by channel for the publisher split, and the Location leaderboard.
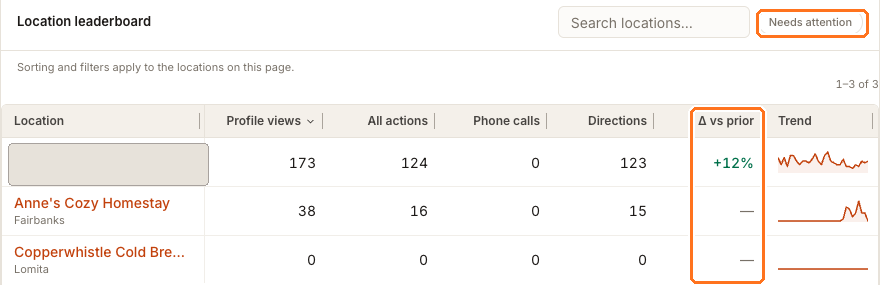
The leaderboard is ranked by profile views, biggest first. Δ vs prior is the column to read — a location can sit near the top and still be falling. Needs attention filters to exactly that: locations whose change against the previous period is negative. A dash means there is no prior period to compare against yet, not a change of zero.
One caveat worth knowing before you sort: Sorting and filters apply to the locations on this page. The ranking itself is done for the whole portfolio, but re-sorting only reorders what is currently loaded.
Watch out for
Questions people ask
One of my publishers shows nothing. Is the connection broken?
Check the strip at the top first. Connected and empty means the publisher reported nothing for that range. Not connected on Google or Facebook is a real gap — take it to listing connection coverage. Not connected on Bing is normal.
Why don't the action cards add up to All Actions?
Because All Actions is the publisher's own total, not a sum Synup calculates from the cards on screen. Publishers count some interactions that don't have a card of their own, so treat All Actions as the headline and the cards as the breakdown you can act on.
Next
If a publisher reads Not connected, start with listing connection coverage — analytics can only report on a listing that is actually connected. To make the clicks that leave your listing attributable in your own analytics, set up UTM tracking rules.