
Read the AEO roll-up
How do I compare AI visibility across all my locations?
Choose a client, then leave the location picker on All locations. This turns AEO into a portfolio view. Use it to move from the brand picture to one location that needs investigation:
- Check whether enough locations have reports.
- Find which location is weak on the AI engine that matters to you.
- Open that location and inspect the evidence behind the gap.
- Return to the portfolio to see whether the issue repeats elsewhere.
Start with a trustworthy portfolio view
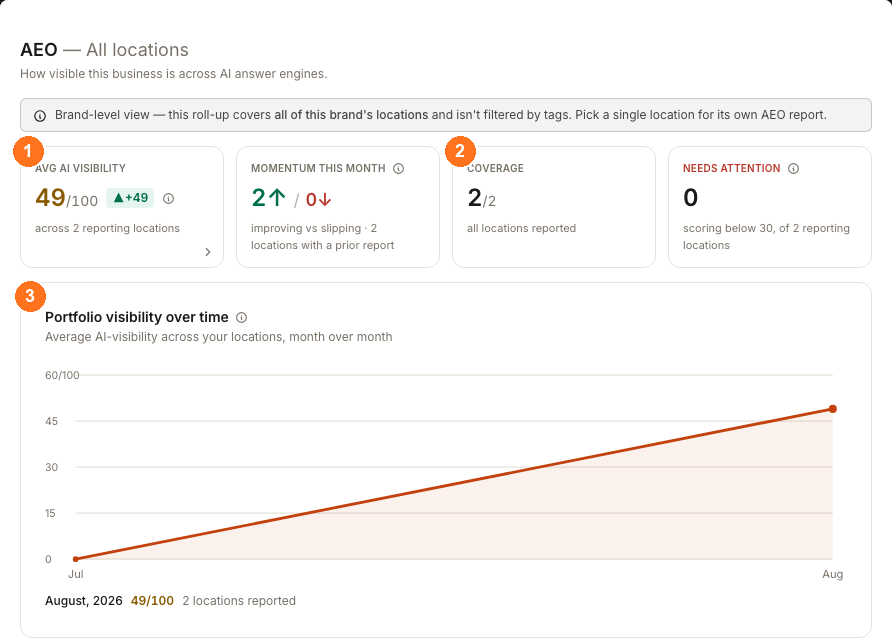
Read ② Coverage before ① Avg AI visibility. Paws & Claws has reports for 2/2 locations, so its 49/100 average represents the whole client: Forest Heights at 55 and Kenton at 43.
If coverage is incomplete, the average includes only locations with a report. A location marked Awaiting first report is unmeasured, not a zero.
To fill that gap, select the location and choose Run AEO report. Synup shows the credit cost before the run starts. See where AEO reports come from before measuring a large portfolio.
Find the location that is weak on your priority engine
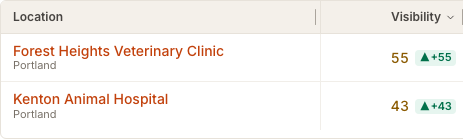
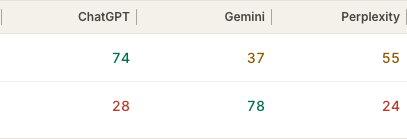
Forest Heights leads overall, 55 to 43, but that does not make it stronger everywhere:
- Forest Heights is stronger on ChatGPT (
74vs28) and Perplexity (55vs24). - Kenton is stronger on Gemini (
78vs37).
Choose the next location from the engine you care about. For a Gemini investigation, follow Forest Heights even though it leads overall. For ChatGPT or Perplexity, follow Kenton.
Open the location and investigate the gap
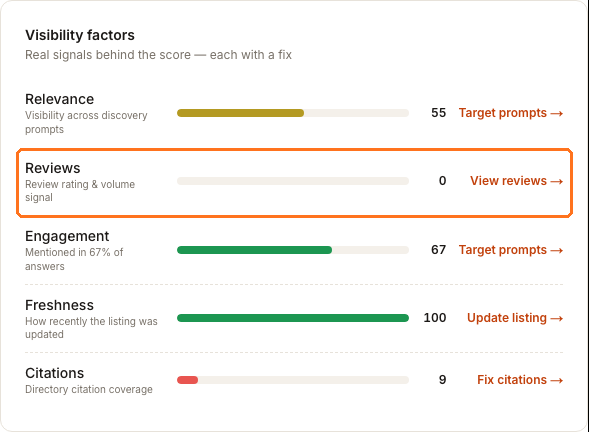
Open Forest Heights and stay on Overview. Its report turns the roll-up comparison into evidence you can investigate:
- Prompt coverage shows the exact questions and engines where the location is strong, partial or absent.
- Visibility factors shows weak supporting signals and links to the Product area where you can inspect them.
Here, Forest Heights has a Reviews factor of 0 and Citations of 9. Those are leads to investigate, not proof that either factor caused its Gemini score. Check the zero Gemini cells in Prompt coverage, then inspect the evidence behind the factors before deciding what to change.
Decide whether the issue is local or shared
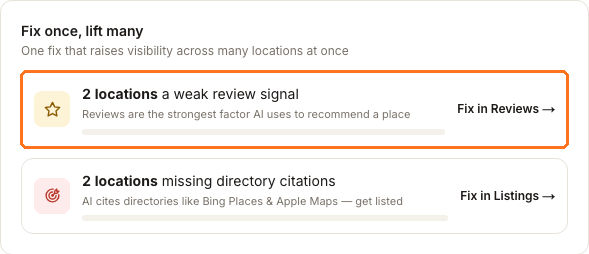
Return to All locations and read Fix once, lift many. It groups factors that repeat across reporting locations. In this example, both locations have a weak review signal, so Reviews is a shared investigation rather than a Forest Heights-only task.
Use the links as routes into the supporting Product area:
- Fix in Reviews for the shared review signal.
- Fix in Listings for missing directory citations.
- Fix in Posts when stale content appears.
Compare the underlying location reports before changing a workflow for the whole brand. A repeated factor tells you where to look together; it still does not prove the cause.
Use health bands to narrow a larger portfolio
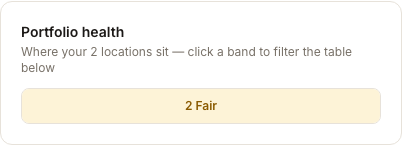
Portfolio health is a quick filter, not another score:
- Strong: 60 or above
- Fair: 30–59
- Weak: below 30
- No report: not measured yet
Paws & Claws shows 2 Fair. Click a visible band to filter the location table, then choose the location and engine to investigate. Needs attention counts only reporting locations below 30; it excludes locations with no report.
Read movement with coverage
Momentum this month compares locations that have both a current and previous report. The ③ trend uses the locations that reported in each month. Hover a trend point to see how many locations contributed; if that count changes, part of the movement may come from the reporting population rather than performance.
Watch out for
Where to go next
- What does my AI Visibility score actually measure? — what each location's number is counting
- What should I fix first to improve AI visibility? — the single-location version of Fix once, lift many