
Understand client health
How do I read a client’s coverage, reviews, and health score?
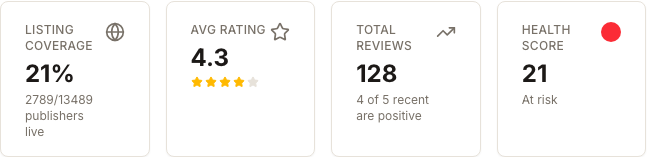
Open Clients for portfolio health, or select one client for its summary cards. Listing Coverage, Avg Rating and Total Reviews are the measured inputs behind Health Score. Use the score to decide where to investigate, then open the relevant Listings or Reviews workspace; do not treat the score alone as a diagnosis.
Key facts
| Where it lives | Clients, then select a client |
| Score range | 0–100, or a dash when nothing has been measured |
| Standard weighting | Listing coverage 40%, Google rating 40%, review volume 20% |
| Detail-page bands | Good at 75–100; Needs attention at 50–74; At risk below 50 |
| Client-list At risk scope | Any measured score below 60 |
Why this matters
Coverage, rating and review volume describe different problems. Low coverage calls for listing work, a weak rating calls for review-quality investigation, and low volume calls for a review-acquisition plan. The combined score is useful for prioritization, but the three inputs tell you what to do next.
Read the portfolio first
- Open Clients.
- Use the four tiles to see total clients, active clients, clients below the list's at-risk cutoff and clients added in the last 30 days.
- Select the At risk tile or choose View → At risk to narrow the table to measured scores below 60.
- Read the Health cell. Its tooltip shows the listing, rating and volume contributions when those factors are available.
- Select a client row to investigate the score rather than acting on the number alone.
Read one client's summary
- Start with Listing Coverage. It is the percentage of measured publisher listings currently live. The subtext shows live publishers over total measured publishers.
- Read Avg Rating. The rating contribution is the Google rating scaled from five stars to 100.
- Read Total Reviews. Review-volume credit increases up to 50 Google reviews; additional reviews do not raise that score component above 100.
- Read Health Score last. Under the standard formula, listing coverage and rating each carry 40% and review volume carries 20%.
- Open the module tied to the weakest measured input. Use Listings for publisher coverage and Reviews for rating, review volume and response work.
How missing data is handled
Synup scores only dimensions it has actually measured. Missing coverage, rating or review count is excluded and the remaining measured weights are rebalanced; it is not silently counted as zero. If none of the three inputs has been measured, the score is a dash.
This distinction matters: zero percent live after a scan is a measured problem, while no listing scan is an unknown. Likewise, zero reviews is measurable when the count is known, but an absent count is not evidence that the client has none.
What you'll see when it's done
- A portfolio view narrowed to the clients that need investigation
- A 0–100 health score or a dash for unmeasured clients
- Separate coverage, rating and review-volume evidence for choosing the next module
- A health label on the client detail page: Good, Needs attention or At risk
Watch out for
Questions people ask
Why does Health show a dash?
Synup has not measured listing coverage, Google rating or Google review count for that client. A dash means unknown, not zero, and the client is not included in the at-risk count.
Why did the score change after listings or reviews synced?
The score is recomputed from current measured inputs. A newly available dimension joins the weighted calculation, so the result can move even when the older inputs did not change.
Does 50 reviews mean the client has enough reviews?
It means the volume component has reached its scoring cap. It is not a universal business target and says nothing about rating, recency, response quality or listing coverage.
Which number should I use for prioritization?
Use Health Score to rank attention, then use the three inputs to choose the work. Reporting only the score hides whether the underlying issue is coverage, reputation quality or review volume.
Next
Use searching and saving client views to create a repeatable at-risk queue. Then open the relevant review analytics or Listings workspace for the measured problem.