
Synup replaced three tools and a spreadsheet. We manage listings for 400+ locations and the agent keeps every profile accurate — without us ever logging into each platform.
 Kirby Kushner
The agent tracks your local rankings across a geographic grid, compares you to competitors, and tells you exactly what to improve, with AI-powered recommendations tied to your Google Business Profile.
A 7×7 grid of rank checks, overlaid on your actual service area. See exactly where you rank #1 and where you're invisible, for every keyword you track. Scrub through time to watch your position change, month by month.
See which competitors dominate your service area, compare your Google Business Profile feature by feature, and identify the specific gaps costing you rank.
The agent analyzes your grid data and generates specific, actionable recommendations tied to your Google Business Profile. Each one includes an impact estimate, the exact GBP field to update, and a step-by-step checklist.
Sonoran Smiles ranks for 4 categories you're missing. Adding relevant categories expands the queries you're eligible to rank for.
You have 42 photos; the category leader has 180. Increasing photo count improves profile engagement.
Your profile has no description. A keyword-rich summary helps Google understand your services and service area.
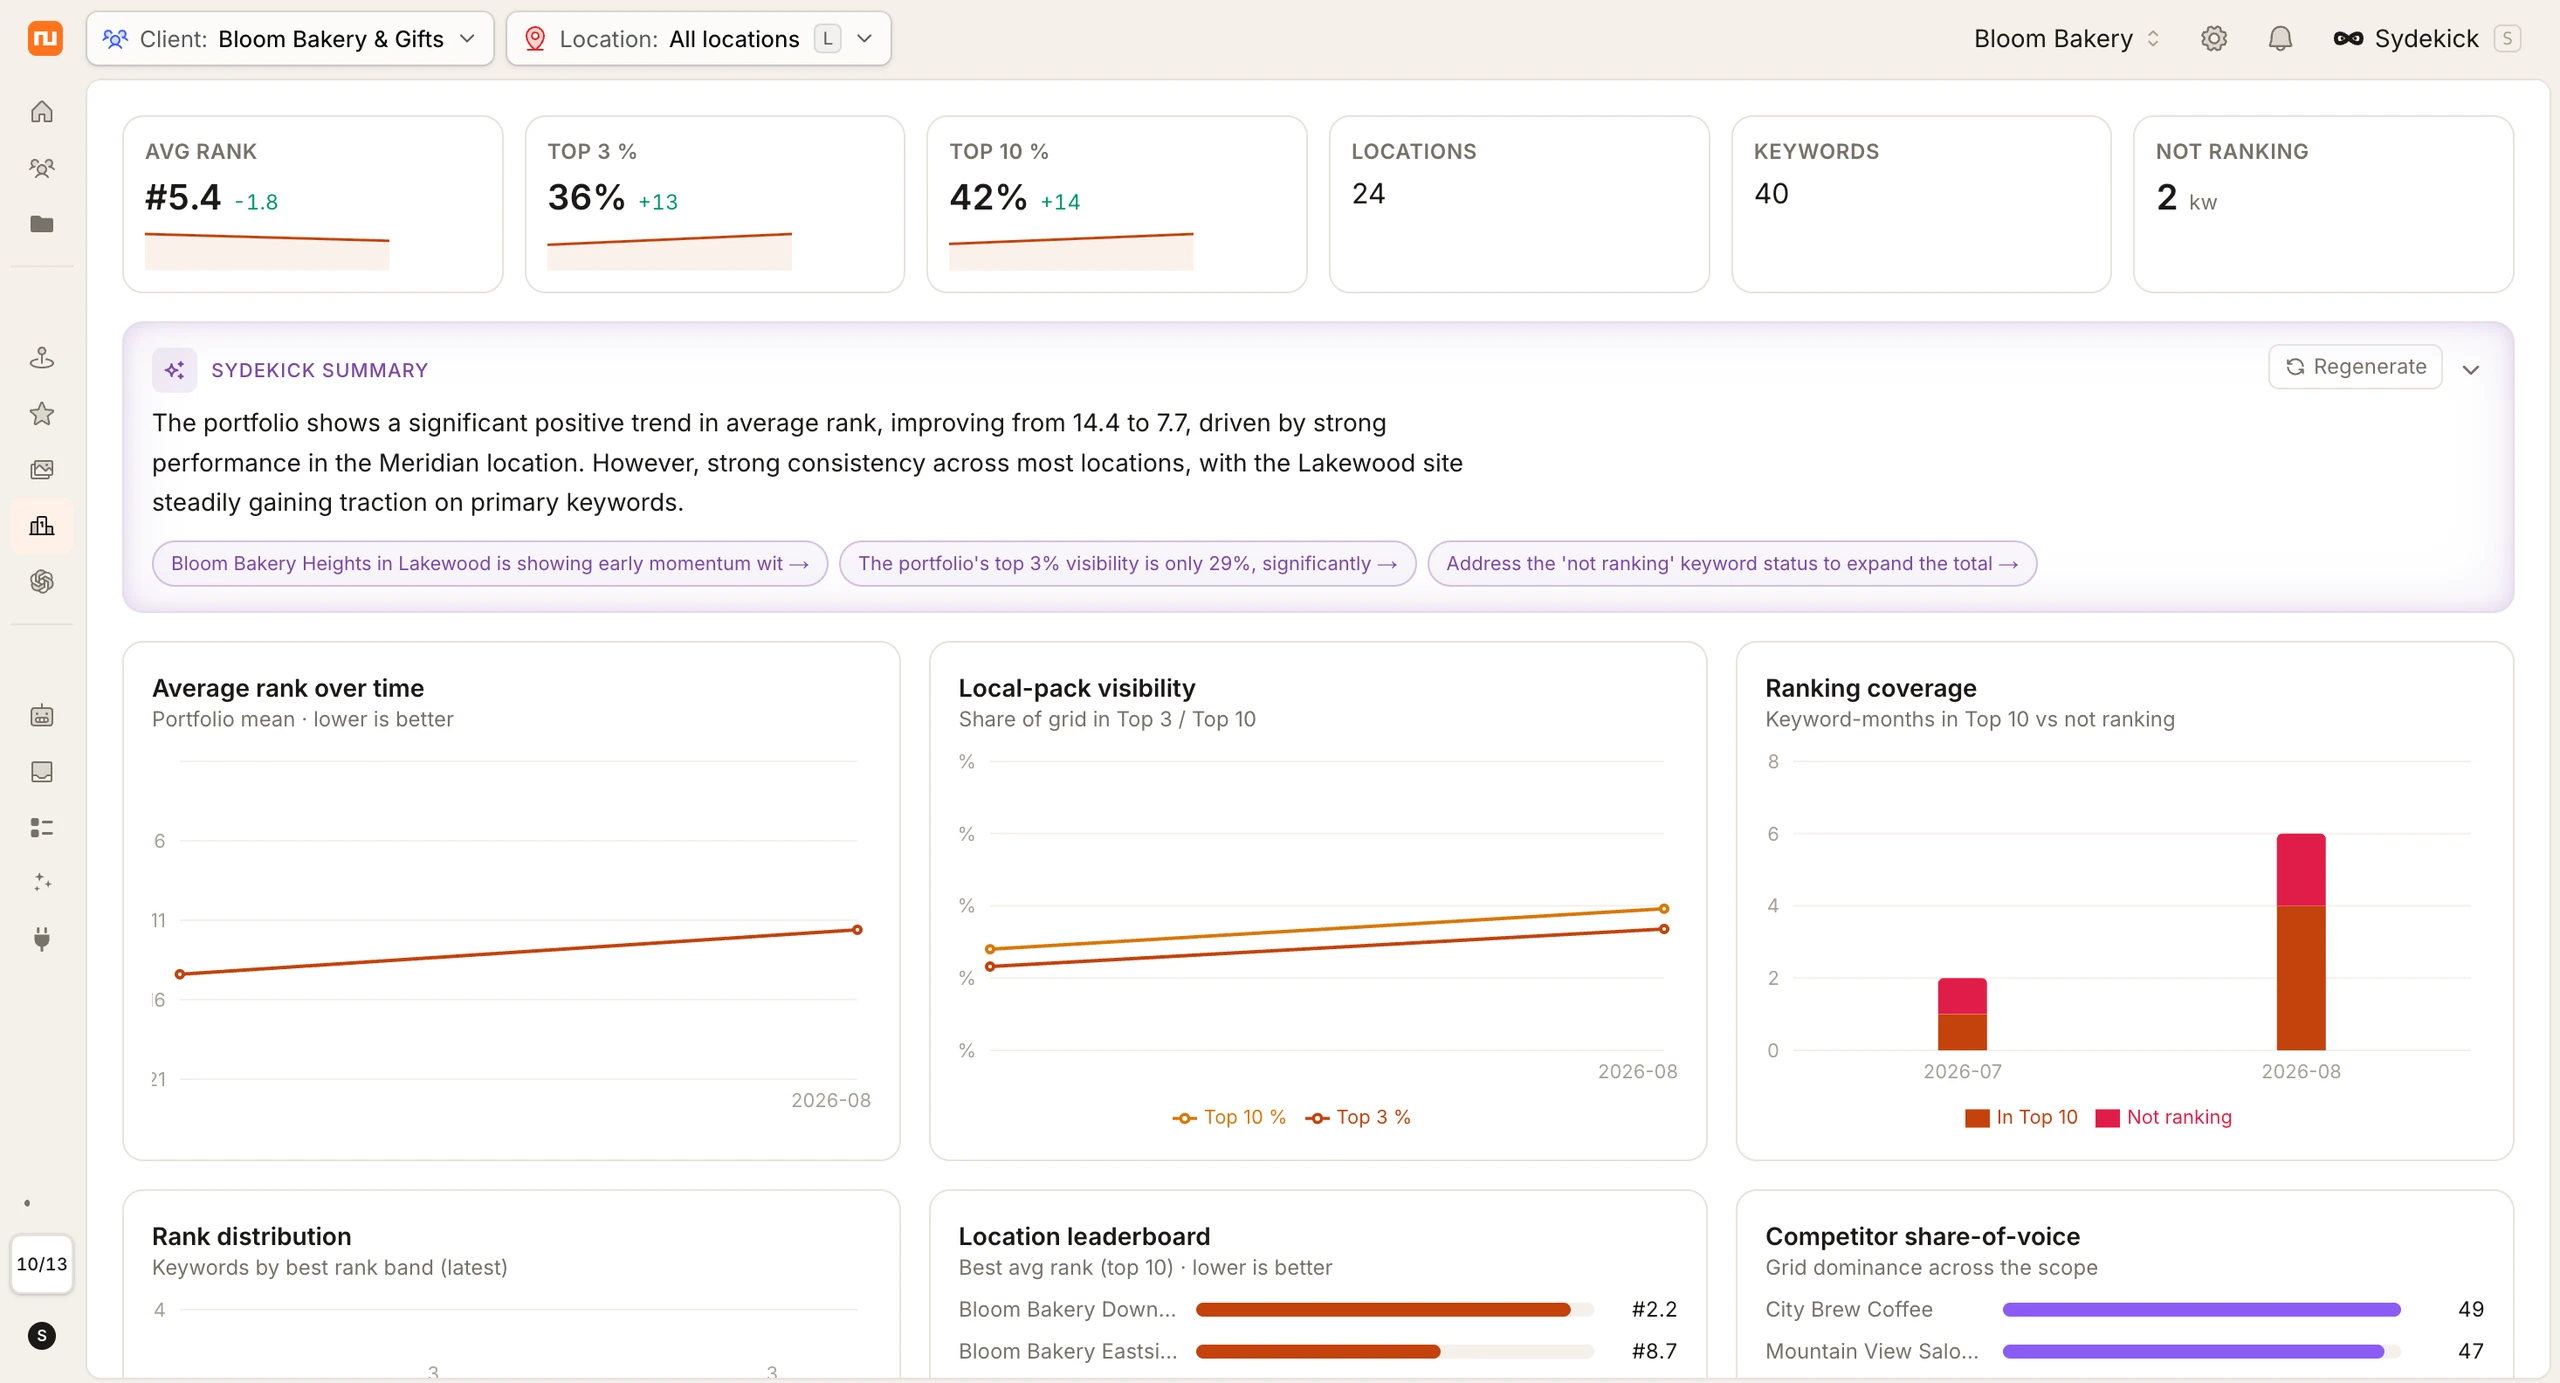
Roll every location's grid into a single portfolio view: average rank, top-3 and top-10 coverage, and the keyword carrying each market. The weakest locations sort to the bottom, so the next place to work is never a guess.
Atlas Dental, Gilbert Heritage dropped from #6.2 to #9.4 this month. The decline is concentrated in "pediatric dentist" keywords, where Desert Ridge Dental gained 3 positions.
Visualize, compare, and report on your local rankings, every part of the workflow, in one map-driven tool.
Switch between grid points, a heatmap overlay, or both on a single map.
View guideA floating panel explaining algorithm updates and competitor activity.
View guideMulti-line chart tracking rank over time for up to 10 keywords at once.
View guideAdd new keywords with a grid-distance slider and a live map preview.
View guidePDF reports with date-range, keyword, and competitor selectors.
Toggle competitor pins on and off the grid map to compare coverage.
View guideSummary of every location with avg rank, top-3%, and best keyword.
View guide
Synup replaced three tools and a spreadsheet. We manage listings for 400+ locations and the agent keeps every profile accurate — without us ever logging into each platform.
Kirby KushnerThe questions teams ask most before they let the agent track their map.
The grid rank map shows how your business ranks for a keyword across a 7×7 grid covering your service area. Instead of giving you one overall city-wide ranking, it shows how your position changes from one part of the area to another.
Rankings are checked monthly by default, with options for more frequent monitoring. Each check is saved, so you can use the time slider to see how your rankings have changed over time.
The Listings page gives you a snapshot of your current ranking and citation strength. The SEO page goes deeper with geographic grid rankings, historical performance, competitor analysis, and AI-powered recommendations to help you understand where you rank and what you can improve.
Yes. You can see where competitors outrank you across the grid and compare Google Business Profile details such as categories, services, photos, hours, and more. This helps you identify specific areas where your profile can improve.
AI recommendations use your grid ranking data, Google Business Profile completeness, competitor information, and search patterns to identify opportunities for improvement. Recommendations include an estimated impact and point you to the profile fields that can be updated.
You can track up to 25 keywords per location. The Keyword Opportunity Finder can also suggest additional keywords based on what customers are searching for.
Start your free trial and map your local rankings, block by block. See the agent work on your business in minutes.