
Local rank tracking: why two reports disagree, and how to compare them
Two local rank reports for the same business, keyword and day can still disagree: one says average rank 11, the other 3.5. Before you pick the better number or decide a tool is broken, ask one question: did the rankings change, or did the measurement change? Check the keyword, listing, search setup, pin locations and timing; compare only the pins both reports share; keep "not found" and "failed" pins apart; and use Search Console as a second opinion. Then land on one verdict: explained, real difference or inconclusive.
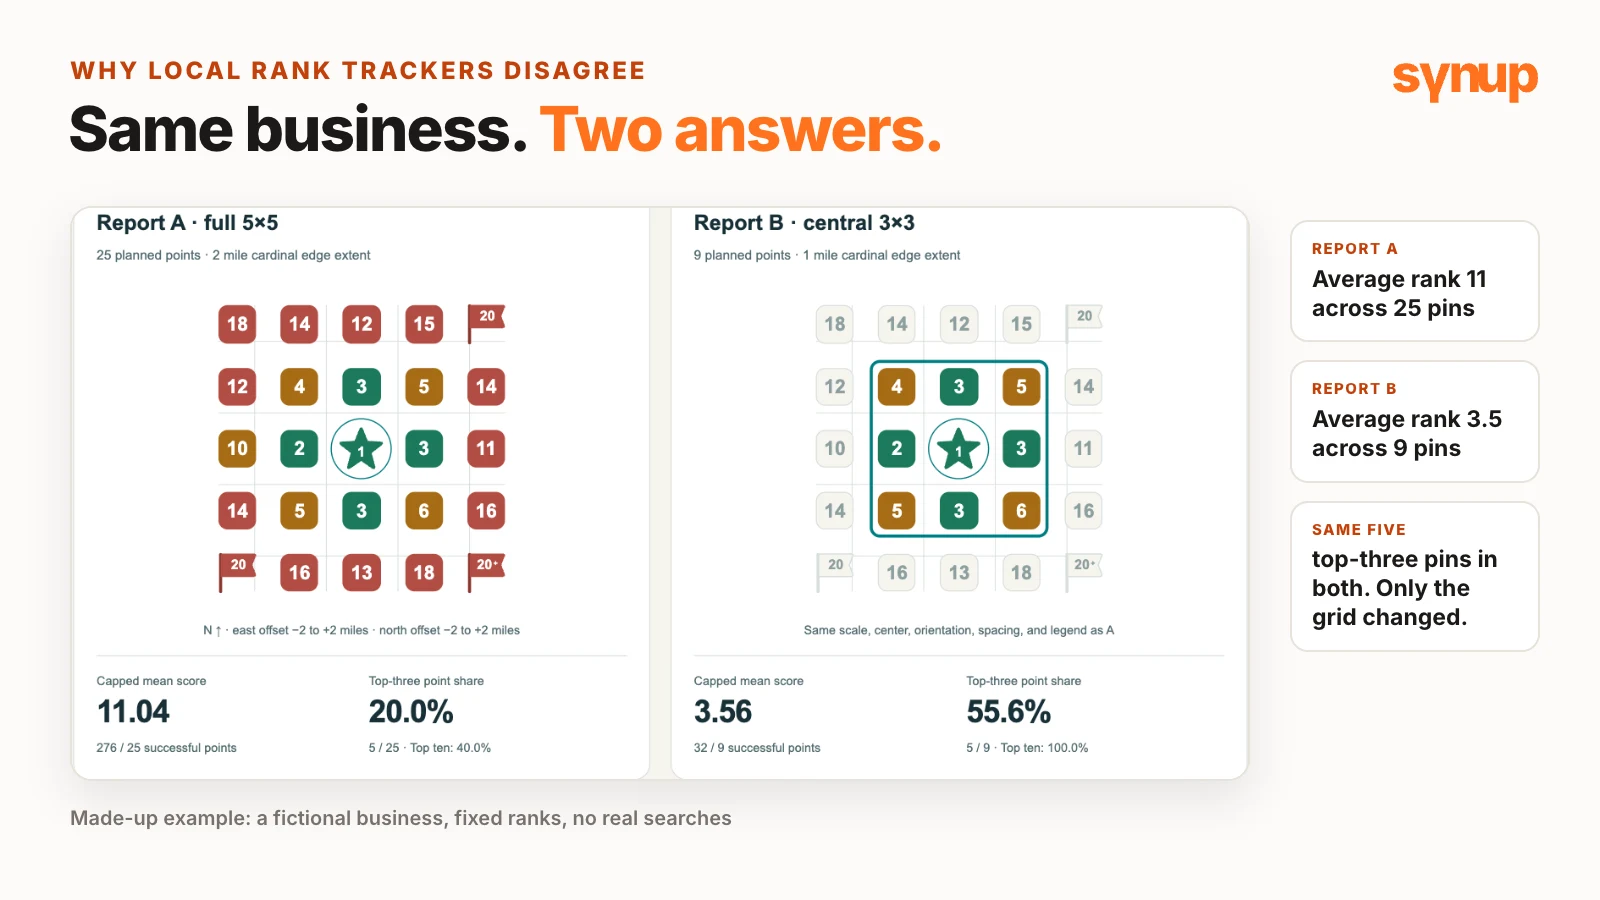
Two local rank reports for the same business, the same keyword and the same day. Report A says the average rank is 11. Report B says 3.5. Which one is right?
Niladri Sarkar, Synup’s CMO, has been hearing a lot of talk about rank tracking lately, and over the past year Niladri’s own experience of trusting rank data from major tools has been less than satisfactory. Mismatched reports come up all the time. A client forwards a report from another tool, or from a vendor trying to win their business. A boss at a multi-location brand forwards one and asks what’s going on at a branch. The easy moves are to report the better number or to decide one of the tools is broken. Both skip the real question.
Short answer: In local rank tracking, two reports disagree mostly because they measured different things: a different keyword, listing, search setup, set of pins or time, or a different way of scoring pins where the business didn’t show up. Before comparing any summary, ask: did the rankings change, or did the measurement change? Check the setup, compare only the pins both reports share, keep “not found” and “failed” pins apart, and use Search Console as a second opinion. Then land on one verdict: explained, real difference or inconclusive.
Watch: local rank tracking, and why two reports disagree
What local rank tracking measures
Search for a plumber or a dentist near me and Google shows a short list of nearby businesses on the map. Where a business appears depends heavily on where the search was made: it can be first on one street and missing a mile or two away.
A local rank tracker runs the same search from a set of pins across a map. Each pin is a location, and the tracker records where the business shows up from each one. The result is a picture of visibility across the whole area a business serves, not one spot.
That matters because the map results are where local customers choose who to call. Agencies use these reports to show clients where they’re visible and whether the work is paying off. Brands and multi-location businesses use them the same way. It’s also why it hurts when two reports, from two tools or even the same tool, disagree.
Download: Rank Report Reconciliation Checklist (PDF), Niladri’s one-page version of everything below.
Local rank tracking: ask one question first
Keep one question the whole way through: did the rankings change, or did the measurement change?
Everything in Niladri’s example is made up: a fictional business, Juniper Bench Plumbing, with fixed ranks and no real searches. It isn’t a comparison of vendors or a screenshot of any real tool. It’s a small, controlled example, so you can see exactly what moves a number.
A rank is a snapshot
Each pin on a grid report is a spot on the map where a search was run. The number on the pin is where the business showed up from that spot.
A rank isn’t a fixed fact about your business, and the business won’t rank there forever. It’s a snapshot that depends on:
- Which listing was checked.
- Which keyword was searched.
- Where the search ran from.
- Which device: desktop, tablet or phone.
- When it ran. This matters a lot in local search.
Change any of these and you’re looking at a completely different measurement.
Five things to check before you compare
Put the two reports side by side and make sure they measure the same thing.
- Keyword, copied exactly. “Plumber”, “plumber near me” and “emergency plumber San Diego” are different searches.
- Listing. The name isn’t enough. Check for another branch at the same location or a business with a similar name, and match the Maps link, address and pin.
- Search setup. Google Maps or the local pack in regular search? Desktop or mobile? Any filters?
- Pin locations. Compare where the pins actually sit, not the city name or the radius setting.
- Timing. When did each search run? Was the business open, and were the competitors? Local results can change with opening hours, so a check while the business is closed can look very different from one while it’s open.
Then ask one question about the math: how does each tool score a pin where the business didn’t show up? Tools handle it differently.
The radius trap
In Report A, a 5×5 grid, the pins are one mile apart, five per side. The edge pins (north, south, east and west) are two miles from the center. The corner pin is two miles north and two miles east at the same time, which puts it about 2.8 miles out.
So is the radius two miles or 2.8? Tools answer that differently. Two reports can both say “two-mile radius” and still search from different spots.
| Report A: full 5×5 | Report B: central 3×3 | |
|---|---|---|
| Pins | 25, one mile apart | 9, the same spacing |
| Average rank | 11.04 | 3.56 |
| Top-three share | 20% (5 of 25 pins) | 55.6% (5 of 9 pins) |
| Top-three pins | The same five pins | The same five pins |
Report B looks much better: the business is in the top three more than half the time, against one time in five. But count the top-three pins and they’re the same five in both. Report B didn’t find any strong spots; it left out the weak ones near the edge. No ranking improved. Only the pins counted changed.
Is Report B wrong? No. It shows how the business does close to home, while A covers a much wider area. A wide grid suits a service-area business; a café that gets most of its customers from three to five miles away needs a different view. And remember that top-three share is a share of pins on the map, not of customers, calls or traffic.
The fix: compare only the pins both reports share, pin for pin. Here the whole gap came from the size of the grid. And don’t stretch the overlap: Report B never looked at the outer edge, so a match near the center tells you nothing about how the business does out there. Different grids, no comparison.
Going forward: log the grid and save the setup, and if you can, run both tools on the same pins next time.
Set the distance between pins
In Synup, you set the distance between points when you add a keyword. Niladri’s own default is one mile apart. If a business serves a larger area, something different may suit it better.
More pins aren’t proof of more visibility. A denser grid shows more detail; it doesn’t mean the business got more visible. See Synup’s local grid ranking for how the grid works in the product.
Blank pins: not found or failed
A pin can come back three ways:
- Found. The business showed up, and you get a rank.
- Not found. The search worked, but the business wasn’t in the results. That tells you something about the business.
- Failed. The search failed or timed out, and there’s no data. That tells you nothing.
On a grid, “not found” and “failed” can both appear as the same dash. In Niladri’s example, three of Report B’s searches failed: 22 of 25 pins came back, 88% coverage, and every other pin matches Report A.
- Don’t copy last month’s data into the gaps and report it.
- Tell the client exactly what happened, and what you don’t know. The real picture may be a little better or a little worse than the report suggests.
- Treat ranking data as directional, not absolute.
- Rerun the failed pins if the tool allows it.
- Check coverage first: before you trust any average, find out how many pins actually came back.
When one pin disagrees
In the last scenario, both reports cover the full grid and everything on the checklist lines up. But at the center pin, A says 1 and B says 2. In real life you won’t be told why. Niladri says this happens more often than you’d imagine, and lists the usual causes:
- Tiny moves in location. Google weighs distance heavily in local results, so a search from a few blocks away can change them.
- A different center point. One tracker may center its grid downtown, another on the business pin a few blocks off. A small shift moves every pin.
- Different data providers. Many vendors don’t run their own searches and buy SERP data from third parties, each with its own methods.
- Data center routing. Google serves results from different data centers, and during active updates two of them can briefly return different results for the same search.
- Pins collected one after the other. A 25-pin grid isn’t collected in one instant, so two tools can hit the same pin minutes or hours apart.
- Volatile results. Local results move more on some days than others, especially during algorithm or spam updates.
- Device. Google says results can differ by device. A desktop browser, a phone browser and the Maps app can each show different results.
- Personalization. Trackers usually search logged out. A client checking on their own phone sees results shaped by their history and location.
What to do: look at the pins, not just the headlines: two summaries can hide the one pin that doesn’t match. Then keep both results; don’t average them or pick the one you like. Check the basics: the same listing, the same time, any errors on that pin. Run it again with both tools, close together. Neither result is the absolute truth; you’re seeing how much the results bounce around.
When to call it inconclusive: sometimes you can’t explain the difference. Niladri has been in search for 20 years and says it still happens. Call it inconclusive when you can’t confirm the keyword or the listing, when the two reports barely overlap, or when the missing pin sits right where the client cares most. Rerun it if needed. Tell the client what you saw and what you couldn’t confirm, and don’t blame the algorithm or an update, or credit your own SEO work, without more evidence. That’s how you lose trust.
Rank tracking is getting harder
Niladri notes that tracking itself has become harder, which is one reason major reports can produce very different results:
- Google dropped 100 results per request. In September 2025, Google stopped honoring the setting that let tools pull 100 results in one request.
- “Poisoned SERPs”. This fall, one tracker reported results pages that look normal but list the wrong results. It studied about 27 million results pages and reported 8% swapped from mid-September, peaking around 25% at the end of the month. Other trackers reported lower rates.
- The Bing Search APIs were retired. Microsoft retired them in August 2025, and tools that used them had to find another way in.
Niladri’s take: a rank tracker was never a perfect copy of what customers see, and now some raw data can be wrong before the math even starts. So keep every pin, recheck the odd ones and don’t react to one wild week.
Use Search Console as a second opinion
Niladri now asks agencies and brands to lean more on Google Search Console data:
- It comes from real searches by real people, and doesn’t include ad clicks. Nobody is scraping, so there’s nothing to poison.
- Average position is the topmost position your site held for each query, averaged across the searches where it showed.
- It isn’t perfect. It covers your website in Google Search, not the map grid, and it blends every location and device. It won’t tell you how you rank two miles north of the office, but it gives you a direction.
- Filter for local queries, such as your service plus a city name, or “near me”.
- Multi-location brands: group by location page, then track clicks and impressions month over month.
- Add UTM parameters to your website link on Google Business Profile and other directories that allow it, so the visits from those listings can be tracked separately.
- Read it with the grid. If the grid is up but Search Console is flat, question the grid first. If both move together, you can tell the client with confidence.
The checklist and the verdict
Before two reports go in front of a client, Niladri runs this list (also in the PDF):
- Same keyword and the same listing.
- Same search surface and setup, including pin spacing (one mile versus two can be huge) and mobile versus desktop. If a report doesn’t show a setting, don’t assume it matches.
- Pin locations compared, plus spacing and any dropped pins.
- Collection time recorded: when the scan ran, not when the report was exported. Today’s PDF can hold last week’s scan.
- Results depth, and how each tool handles a missing business: real ranks, not found, failed and excluded pins kept apart.
- Each tool’s own score kept, with your own formula written down.
- Shared pins matched by location. Don’t report on pins that disagree until you’ve checked them.
- Compared with Search Console for the same period.
Then land on one verdict:
| Verdict | When it applies |
|---|---|
| Explained | The gap comes from a setup difference, such as grid size or missing pins. |
| Real difference | The setups match and the ranks still differ on shared pins. |
| Inconclusive | Something important can’t be confirmed yet. That’s an honest answer. |
How Niladri explains the two examples to a client:
- Different grids: “These two reports looked at different areas. Where they overlap, your rankings are exactly the same. The second report looks better only because it covers a smaller area, close to your office. This isn’t a ranking improvement; it’s how it was measured.”
- Missing data: “A few pins didn’t come back, so we have gaps near the edge of your area. Everything we did measure is unchanged. We’re rerunning the missing pins before we call it either way.”
One habit makes all of this easier: decide the question you’re answering, save the pins and the rules, and reuse them next time. If you change the setup, call it a new baseline; don’t join it to an older trend. And the next time two local rank reports don’t match, ask the same question: did the rankings change, or did the measurement change?
For reporting AI answers and the local pack side by side, see how to report AI Overviews and the local pack.
Common questions about local rank tracking reports
Why do local rank trackers show different results for the same business?
Usually because they didn't measure the same thing. A local rank is a snapshot that depends on the listing, the keyword, where the search ran from, the device and the time. Two reports can differ in any of those, in where their pins sit, in how many pins came back and in how they score a pin where the business didn't show up. Even with the same setup, a pin can differ because of small location changes, a different center point, different data providers or searches collected minutes or hours apart.
What is the radius trap in a local rank grid?
On a 5×5 grid with pins one mile apart, the edge pins (north, south, east and west) are two miles from the center, but the corner pins are about 2.8 miles out. Tools describe that radius differently, so two reports can both say "two-mile radius" and still search from different spots.
Why does a smaller grid show a better average rank?
Because it leaves out the weaker pins near the edge, not because any rank improved. In Niladri's example, the five top-three pins are the same in both reports; the 3×3 report simply counts fewer pins, so its average and top-three share look much better.
What's the difference between a "not found" pin and a "failed" pin?
"Not found" means the search worked and the business wasn't in the results, so it tells you something about the business. "Failed" means the search failed or timed out and there's no data, so it tells you nothing. Both can show up as the same blank on a grid. Check how many pins came back before you trust any average, and rerun the failed pins rather than filling them with last month's data.
When should you call a ranking difference inconclusive?
When you can't explain it: for example, you can't confirm the keyword or the listing, the two reports barely overlap, or the missing pin sits exactly where the client cares most. Tell the client what you saw and what you couldn't confirm. Don't blame an algorithm update or credit your own SEO work without more evidence.
Can Google Search Console replace a rank tracker?
No, but it's a useful second opinion. Search Console data comes from real searches by real people, so nothing is scraped and nothing can be poisoned. It covers your website in Google Search, not the map grid, and it blends locations and devices. Filter for local queries, group them by location page and track clicks and impressions month over month.
How far apart should the pins be in Synup?
You choose it. When you add a keyword in Synup, you set the distance between points. Niladri's own default is one mile apart; a business that serves a larger area might want something different. More pins show more detail, but they don't mean the business got more visible.
Put your local marketing in motion.
Manage listings, reviews and local visibility in one place. Sydekick, your AI agent, lines up the work and you approve what goes live.
- 14-day free trial
- $50 in AI credits
- Cancel anytime